Article Outline
– 1. Demand: Meaning, Definition, and Importance
- 2. What Is Demand in Economics?
- 3. Essential Elements of Demand
- 4. Difference Between Demand and Desire
- 5. The Law of Demand
- 6. Demand Schedule and Demand Curve
- 7. Factors Affecting Demand
- 8. Income and Purchasing Power
- 9. Prices of Related Goods
- 10. Change in Demand vs. Change in Quantity Demanded
- 11. Types of Demand
- 12. Demand in Everyday Life
- 13. Demand in Business and Marketing
- 14. Demand Forecasting: Predicting Future Demand
- 15. Relationship Between Demand, Supply, and Market Price
- 16. Elasticity of Demand
- 17. Common Mistakes When Understanding Demand
- 18. Demand in the Indian Economy
- 19. Conclusion
- 20. Frequently Asked Questions (FAQs)
1. Demand: Meaning, Definition, and Importance
Demand is one of the most important concepts in economics, business, marketing, and everyday financial decision-making. Whether a shopkeeper decides how much stock to purchase, a company launches a new product, or a farmer chooses which crop to grow, demand influences the decision.
You may have heard people say, “There is a lot of demand for this product,” or “Demand has fallen because prices have increased.” But what does demand actually mean? Is it simply the desire to buy something, or is there more to it?
In economics, demand has a specific meaning. It refers to the quantity of a product or service that consumers are willing and able to purchase at different prices during a particular period, assuming other relevant factors remain unchanged.
For example, suppose a village shop sells cooking oil. When a one-litre bottle costs ₹120, customers purchase 100 bottles per week. If the price falls to ₹105, customers may purchase 130 bottles per week. This illustrates how a price change can affect the quantity consumers want to buy.
However, demand is not influenced by price alone. People’s income, preferences, expectations, population, the prices of alternative products, and many other factors also matter.
Understanding demand helps individuals make better purchasing decisions and enables businesses to plan production, manage inventory, set prices, and identify opportunities in the market.
2. What Is Demand in Economics?
Demand is the economic relationship between the price of a product and the quantities consumers are willing and able to buy at those prices over a specified period.
Three important conditions must be satisfied for a desire to become effective economic demand.
First, the consumer must want the product. Second, the consumer must have the financial ability to purchase it. Third, the consumer must be willing to spend money on it at the prevailing price.
Consider three people who want to purchase a smartphone priced at ₹20,000.
- Person A wants the phone and has enough money to buy it.
- Person B wants the phone but can afford only ₹8,000.
- Person C has ₹30,000 but is not interested in purchasing a phone.
Person A represents effective demand at that price. Person B has a desire but lacks sufficient purchasing power, while Person C has the financial ability but no willingness to purchase the product.
This distinction is important because businesses cannot build a reliable sales forecast simply by counting people who say they like a product. They must determine how many people are prepared and able to pay for it.
Economists also distinguish between demand and quantity demanded. Demand describes the relationship between prices and quantities across different price levels. Quantity demanded refers to the amount consumers will purchase at one particular price.
For example, a shop may sell 50 bags of rice per week at ₹1,000 per bag and 70 bags at ₹900. The complete relationship between these prices and quantities represents demand, while the 50 bags purchased at ₹1,000 represents quantity demanded at that price.
3. Essential Elements of Demand
To understand demand properly, it helps to examine its main elements.
Desire for a product: Consumers must have a reason to purchase something. The reason may be a basic necessity, convenience, entertainment, status, or business use.
Ability to pay: A consumer needs sufficient income, savings, credit, or another legitimate means of financing the purchase. Interest in a product does not automatically create effective demand.
Willingness to pay: A person may have money but decide that the product is too expensive or unnecessary. The consumer’s perceived value influences the final decision.
Price: The price of a product affects how much consumers are willing to purchase, all else being equal.
Time period: Demand should be measured over a defined period, such as per day, week, month, or year. Saying that a shop sells 500 packets of biscuits is less informative than saying it sells 500 packets per week.
Market and customer group: Demand also needs a defined market. Demand for a product in one village may differ from demand in a large city because of differences in population, income, preferences, and availability.
For businesses, these elements form the foundation of market research. A company must identify who wants the product, how much those customers can afford, and whether they are willing to buy it at the proposed price.
4. Difference Between Demand and Desire
Demand and desire are related, but they are not identical.
A desire is simply a wish to have something. Demand requires both willingness and the financial ability to purchase the product at a particular price.
Imagine that a student wants an expensive laptop worth ₹80,000 but has only ₹15,000 available and no suitable financing option. The student has a desire for the laptop, but not effective demand for it at ₹80,000.
Now imagine a shopkeeper who needs a laptop for billing and inventory management. The shopkeeper has allocated ₹80,000 for the purchase and is ready to buy a suitable model. The shopkeeper’s desire is supported by purchasing power and willingness to spend.
This distinction matters when estimating the potential market for a product.
Suppose 10,000 people in a town express interest in buying a premium water purifier. It would be a mistake to assume that all 10,000 will purchase it. Some may lack the budget, others may choose a cheaper alternative, and some may decide that they do not need it.
A business must therefore distinguish between general interest, potential customers, qualified buyers, and actual sales.
The same principle applies to online businesses. Thousands of people may visit a website, but only a small percentage may complete a purchase. Website traffic indicates interest; completed transactions provide evidence of actual buying behaviour.
5. The Law of Demand
The law of demand is a fundamental principle of microeconomics.
It states that when the price of a product rises, its quantity demanded generally falls, and when the price falls, its quantity demanded generally rises, assuming other factors remain constant. This condition is commonly called ceteris paribus.
Consider the following example of a fruit seller.
| Price per kg | Quantity demanded per day |
| ₹40 | 100 kg |
| ₹50 | 80 kg |
| ₹60 | 60 kg |
| ₹70 | 45 kg |
| ₹80 | 30 kg |
In this hypothetical example, customers purchase fewer kilograms as the price increases.
Why does this happen?
One reason is that a higher price makes the product more expensive relative to the consumer’s budget. Customers may reduce consumption, switch to alternatives, or postpone their purchases.
Another reason is diminishing marginal utility. In simple terms, the additional satisfaction a person receives from consuming one more unit of a product often decreases as they consume more of it. Consumers may be willing to buy additional units only at a lower price.
For example, a family might happily purchase five mangoes at ₹20 each but purchase only two when the price rises to ₹50 each.
The law of demand is a general tendency, not an exception-free rule. Certain unusual goods, market conditions, and consumer behaviours may produce different results. The assumption that other factors remain constant is essential when applying the law.
6. Demand Schedule and Demand Curve
Economists use a demand schedule and a demand curve to represent the relationship between price and quantity demanded.
A demand schedule is a table showing how much of a product consumers would purchase at different prices.
For example:
| Price of a product | Quantity demanded |
| ₹100 | 20 units |
| ₹80 | 30 units |
| ₹60 | 45 units |
| ₹40 | 65 units |
| ₹20 | 90 units |
The figures above are illustrative. They show that a lower price is associated with a greater quantity demanded.
A demand curve is a graphical representation of this relationship. In a standard economics graph:
- The vertical axis represents price.
- The horizontal axis represents quantity demanded.
- The demand curve usually slopes downward from left to right.
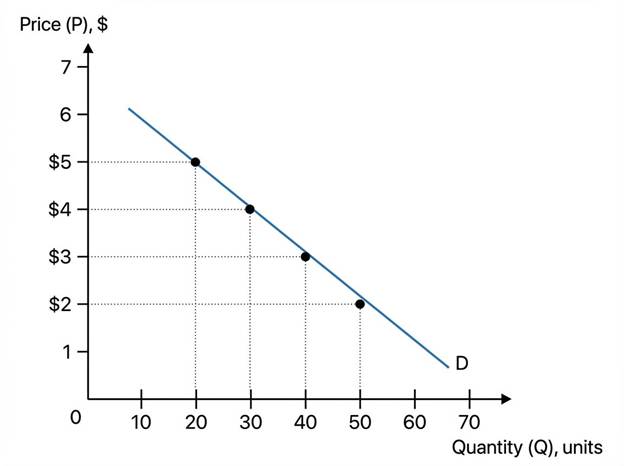
A demand curve makes it easier to understand how consumers respond to different prices. Businesses can use similar data to evaluate pricing decisions and estimate sales at different price levels.
For instance, if a retailer knows that demand increases significantly when the price falls from ₹100 to ₹80, the retailer can investigate whether the extra sales will generate enough revenue and profit to justify the discount.
However, a demand schedule based on hypothetical values is not a substitute for actual market research. Businesses should examine real sales records, customer behaviour, competitors, and seasonal patterns before making important decisions.
7. Factors Affecting Demand
Price is an important determinant of quantity demanded, but several other factors can change demand itself.
Consumer income: When income rises, demand for many normal goods tends to increase. However, demand for some lower-cost alternatives may decrease as consumers switch to preferred products.
Prices of related products: Customers may change their purchases when the prices of substitutes or complementary goods change.
Consumer preferences: Advertising, lifestyle changes, product quality, trends, and brand reputation can influence buying decisions.
Population and customer numbers: A growing population can increase demand for food, housing, transportation, healthcare, and other services.
Expectations about the future: If consumers expect prices to rise soon, they may purchase earlier. If they expect prices to fall, they may postpone some purchases.
Season and weather: Umbrellas, cool drinks, heaters, agricultural inputs, and seasonal clothing often experience changes in demand throughout the year.
Availability of credit: Easier access to affordable credit may increase demand for expensive products such as vehicles, appliances, or homes.
Government policies: Taxes, subsidies, regulations, and public spending can influence household purchasing power and business demand.
These factors do not necessarily affect every product in the same way. A price change that has a substantial effect on demand for a luxury product may have a smaller effect on demand for an essential item.
8. Income and Purchasing Power
Income affects the quantity and types of products people can afford.
For many products, demand increases when consumer income rises. Economists generally classify these as normal goods. Examples may include better-quality clothing, restaurant meals, and certain consumer electronics.
Other goods are known as inferior goods in economic terminology. In this context, inferior does not mean poor quality. It means that demand for the good may decrease as income rises because consumers switch to preferred alternatives.
For example, a household with a limited budget might frequently use a low-cost transport option. If its income increases substantially, the household may use taxis more often or purchase a two-wheeler, reducing its reliance on the original option.
Purchasing power also depends on prices. If a person’s income remains ₹20,000 per month but essential expenses increase, the amount available for discretionary purchases may fall.
This is why businesses should not examine income alone. They should consider household expenses, inflation, access to credit, job stability, and the cost of competing products.
For a small retailer, a practical method is to track which products customers purchase regularly, which products they buy only during festivals, and which items they abandon when prices increase.
9. Prices of Related Goods
The prices of related goods can influence demand in two important ways.
Substitute goods can replace one another. Examples include tea and coffee for some consumers, or two brands offering similar products.
Suppose a customer regularly buys Brand A cooking oil for ₹150 per litre. If its price rises to ₹180 while a similar Brand B remains at ₹150, some customers may switch to Brand B. Demand for Brand B may increase.
Complementary goods are products commonly used together. Examples include printers and printer cartridges, or vehicles and fuel.
If the price of fuel rises sharply, some consumers may reduce unnecessary driving. This can affect demand for related services or products, although the size of the effect depends on the availability of alternatives and how essential the product is.
These relationships help companies understand why their sales may change even when their own prices remain unchanged.
A retailer should therefore monitor competitors’ prices and relevant complementary products rather than studying only its own price list.
10. Change in Demand vs. Change in Quantity Demanded
This is one of the most important distinctions in economics.
A change in quantity demanded occurs when the product’s own price changes, assuming other factors remain constant. It is represented by movement along the existing demand curve.
A change in demand occurs when a non-price determinant changes, such as income, preferences, population, or the price of a related product. It is represented by a shift of the demand curve.
Consider a shop selling 100 packets of a product at ₹50 each. When the shop reduces the price to ₹40, customers purchase 130 packets. This is an increase in quantity demanded due to the price reduction.
Now suppose a popular public figure recommends the product and more consumers become interested in it. At the same price of ₹50, customers now want to purchase 150 packets instead of 100. This is an increase in demand.
Demand can also decrease. If consumer preferences shift away from a product, fewer units may be purchased at every price, causing the demand curve to shift to the left.
The distinction is useful because it helps businesses identify the correct response. A temporary discount may increase quantity demanded, but it may not solve a deeper problem caused by poor quality, changing preferences, or the arrival of a stronger competitor.
11. Types of Demand
Demand can be classified in several ways depending on the relationship between products, the purpose of purchase, and the market being studied.
Individual demand: The quantity a single consumer is willing and able to purchase at different prices during a given period.
Market demand: The combined demand of all consumers in a defined market. For example, the total weekly demand for rice across all households in a town.
Direct demand: Demand for a product that satisfies a consumer’s need directly, such as food, clothing, or entertainment.
Derived demand: Demand that arises because another product or service is needed. For example, demand for mining equipment may arise from demand for mineral production. If mining activity expands, the need for machinery, spare parts, fuel, and maintenance services may also increase.
Joint demand: Demand for products that are used together, such as a vehicle and its fuel.
Competitive demand: Demand for alternative products that can satisfy a similar need. For example, customers may choose between different brands of packaged drinking water.
Seasonal demand: Demand that changes at predictable times of the year. Examples include umbrellas during rainy periods and decorative goods around festivals.
Business demand: Demand from organisations purchasing goods or services for operations, production, or resale. Examples include office supplies, industrial lubricants, and spare parts.
Understanding the type of demand helps businesses choose appropriate pricing, inventory, and marketing strategies.
12. Demand in Everyday Life
Demand is not limited to economics textbooks. It influences everyday decisions in households, villages, towns, and cities.
Imagine a family preparing its monthly budget. It needs rice, cooking oil, vegetables, school supplies, electricity, and transportation. The family has limited income, so it must decide how much to purchase and which expenses to prioritise.
If vegetable prices increase, the family may buy seasonal vegetables, reduce wastage, or change its meal plan. If school fees rise, it may reduce spending on entertainment. These choices reflect how consumers respond to changing prices and budgets.
Demand also affects small businesses.
Suppose a village shop sells 40 packets of biscuits per day but regularly runs out of popular snack brands in the evening. The owner might analyse sales records and discover that demand rises after school hours. Keeping additional stock during that period could reduce missed sales.
A farmer faces similar decisions. Before planting a crop, the farmer may consider expected market prices, local buyer demand, storage costs, transportation, weather, and the availability of competing crops.
In each case, the central question is the same: What are people likely to buy, in what quantity, at what price, and during which period?
Accurate answers help individuals use their resources more effectively.
13. Demand in Business and Marketing
Businesses need demand to turn a product idea into a commercially viable operation.
Before launching a product, a business should identify its target customers, understand the problem the product solves, estimate how much customers can pay, and assess competing offers.
For example, imagine an entrepreneur planning to sell clay water pots in a nearby town. Interest in traditional products may exist, but that alone does not guarantee profitable sales.
The entrepreneur should investigate:
- How many customers regularly purchase clay pots?
- Which sizes and designs are popular?
- What prices do local sellers charge?
- How much do raw materials, production, packaging, and transport cost?
- Does demand rise during particular seasons?
- Are customers willing to pay more for better finishing or delivery?
A small test can provide useful evidence. The entrepreneur could purchase a limited batch, record enquiries, sales, returns, and customer feedback, and then decide whether to increase stock.
Marketing can influence demand by informing consumers, demonstrating product value, building trust, and making a product easier to purchase. However, promotion cannot guarantee sales if the product does not meet customers’ needs or is priced beyond their budgets.
Businesses should also distinguish revenue from profit. Selling more units does not automatically mean earning more money. A discount may increase sales volume but reduce the profit earned per unit.
The best strategy depends on the relationship between price, demand, costs, and customer retention.
14. Demand Forecasting: Predicting Future Demand
Demand forecasting is the process of estimating how much of a product or service customers are likely to purchase in the future.
Businesses use forecasts to plan production, purchase stock, schedule workers, allocate budgets, and avoid unnecessary inventory.
There are several practical forecasting methods.
Historical sales analysis: Review past sales records to identify average demand, growth, and recurring patterns.
Seasonal analysis: Examine how demand changes during festivals, weather changes, school seasons, harvest periods, or other recurring events.
Customer surveys: Ask potential buyers about their needs, preferences, and likely purchasing decisions. Survey responses should be treated cautiously because stated intentions may not become actual purchases.
Market research: Study competitors, customer segments, price changes, and developments in the local market.
Sales-team estimates: Collect information from people who regularly interact with customers, distributors, and suppliers.
Statistical forecasting: Use averages, trend analysis, regression, or other suitable methods when enough reliable data is available.
Consider a simple example. A shop sells 300 units of a product in January, 320 in February, and 310 in March. A basic average forecast for the next month is:
\[ \text{Average demand}=\frac{300+320+310}{3} \]
\[ \text{Average demand}=310\text{ units} \]
This method is simple, but it assumes recent sales provide a useful indication of future demand. If a festival, price increase, supply shortage, or major competitor changes the market, the forecast may be inaccurate.
A stronger forecast combines historical figures with business knowledge and current market conditions.
Forecasting is not about predicting the future perfectly. It is about making better decisions using the best available evidence.
15. Relationship Between Demand, Supply, and Market Price
Demand and supply interact to influence market prices and the quantities traded.
Demand represents the quantities consumers are willing and able to buy at different prices. Supply represents the quantities producers are willing and able to sell at different prices.
In a simplified competitive market, the equilibrium price occurs where quantity demanded equals quantity supplied. At that price, the planned purchases of buyers match the planned sales of sellers.

OpenStax
+1
Suppose customers want to buy 500 bags of rice per week at a particular price, and sellers are willing to supply 500 bags. The market is in equilibrium under these simplified conditions.
If demand increases while supply remains unchanged, the market may experience upward pressure on prices. Sellers may respond by bringing more stock to market, and prices may eventually settle at a new equilibrium.
If supply increases while demand remains unchanged, prices may face downward pressure.
Real markets are more complicated. Government regulations, transportation costs, market power, taxes, storage, expectations, and international trade can influence the final price.
For example, poor weather may reduce the supply of certain vegetables. Even if consumers’ underlying preferences remain unchanged, lower availability can increase prices.
Similarly, a sudden rise in consumer interest may create shortages if suppliers cannot increase production quickly enough.
Understanding both demand and supply is therefore essential for explaining why prices change.
16. Elasticity of Demand
Elasticity of demand measures how responsive quantity demanded is to a change in price or another relevant factor.
Price elasticity of demand is commonly calculated as:
\[ \text{Price Elasticity of Demand} = \frac{\%\text{ change in quantity demanded}} {\%\text{ change in price}} \]
Because price and quantity demanded usually move in opposite directions, the result is often negative. In many introductory discussions, economists focus on its absolute value to describe the strength of the response.
Suppose the price of a product increases by 10%, and quantity demanded decreases by 20%.
\[ \text{Elasticity}=\frac{-20\%}{10\%}=-2 \]
The absolute value is 2, indicating an elastic response: quantity demanded changes proportionately more than price in this example.
Demand is generally described as:
- Elastic when quantity demanded responds relatively strongly to a price change.
- Inelastic when quantity demanded responds relatively weakly.
- Unit elastic when the percentage change in quantity demanded equals the percentage change in price in absolute terms.
Products with readily available substitutes may have relatively elastic demand. Essential goods with few alternatives may have relatively inelastic demand over certain periods, although this depends on the product and the circumstances.
Time also matters. Consumers may be unable to change their behaviour immediately after a price increase but may find alternatives over several months.
Businesses use elasticity to evaluate pricing decisions. A price reduction can increase revenue when the rise in quantity sold is sufficiently large, but the outcome depends on the actual elasticity and the firm’s costs.
17. Common Mistakes When Understanding Demand
Several misunderstandings can lead to poor economic or business decisions.
Mistake 1: Treating desire as demand. Many people may like a product, but fewer may be willing and able to buy it at the proposed price.
Mistake 2: Confusing demand with quantity demanded. A price change usually causes movement along a demand curve, while changes in income, preferences, or other determinants may shift the entire curve.
Mistake 3: Assuming lower prices always mean higher profits. Lower prices may increase sales volume, but the resulting profit depends on costs and the size of the sales increase.
Mistake 4: Ignoring competitors. Demand for one product may fall when consumers switch to alternatives, even if the product’s own price has not changed.
Mistake 5: Relying only on opinions. Customer surveys are useful, but actual transactions and repeat purchases often provide stronger evidence of buying behaviour.
Mistake 6: Ignoring the time period. Daily demand may fluctuate while monthly demand remains stable. Comparing figures from different periods without adjusting for seasonality can produce misleading conclusions.
Mistake 7: Assuming high demand guarantees a good business. A product can sell quickly but still be unprofitable if production, transport, marketing, or operating costs are too high.
The solution is to combine economic principles with accurate data, careful observation, and practical testing.
18. Demand in the Indian Economy
Demand plays a major role in India’s economic activity because household consumption, business investment, government expenditure, and exports all contribute to overall economic activity.
The Government of India’s Economic Survey 2025–26 reported that private final consumption expenditure was estimated to account for 61.5% of GDP in FY 2025–26, its highest share since FY 2011–12. The Survey also reported that private consumption grew by 7.5% during the first half of FY 2025–26. These figures illustrate the importance of consumer spending in India’s economy.
Consumption demand includes purchases such as food, clothing, transport, healthcare, housing-related services, and consumer electronics. Business investment creates demand for machinery, equipment, construction services, technology, and other productive resources. Government spending can also support demand for goods and services.
Demand differs across regions and customer groups. Rural and urban households may have different income patterns, purchasing priorities, product preferences, and access to markets. Seasonal agricultural income can influence spending on vehicles, household goods, farm equipment, and local services.
For small businesses, these differences create opportunities—but they also create risks. A product that sells well in one district may not perform equally well in another.
Entrepreneurs should research their actual target market rather than relying only on national economic statistics. Useful local evidence includes competitor prices, customer interviews, sales records, repeat purchases, and the number of potential buyers within a realistic delivery area.
For individuals, understanding demand improves financial awareness. It helps explain why certain products become expensive, why businesses change prices, and why employers or entrepreneurs pay attention to customer needs.
19. Conclusion
Demand is much more than simply wanting to buy a product. In economics, it refers to the quantity consumers are willing and able to purchase at different prices during a specified period.
The concept becomes easier to understand when you distinguish demand from desire, learn the law of demand, study demand schedules and curves, and identify the factors that influence consumer behaviour.
Demand also explains important business decisions. Retailers use it to manage inventory, manufacturers use it to plan production, marketers use it to understand customers, and entrepreneurs use it to assess business opportunities.
Remember three core principles:
- Effective demand requires both willingness and the ability to pay.
- A product’s price generally influences the quantity demanded, while factors such as income and preferences can change demand itself.
- Understanding demand alongside supply, costs, and competition leads to better decisions.
Whether you are studying economics, managing a shop, working in a business, or planning a new venture, demand analysis helps you move beyond assumptions and make decisions based on evidence.
20. Frequently Asked Questions (FAQs)
1. What is demand in simple words?
Demand is the quantity of a product or service that people are willing and able to buy at different prices during a particular period. Simply wanting a product is not enough; the buyer must also be able and willing to pay for it.
2. What is the law of demand?
The law of demand states that, other things remaining constant, quantity demanded generally decreases when price increases and increases when price decreases.
3. What is the difference between demand and quantity demanded?
Demand describes the relationship between a range of prices and the quantities consumers are willing and able to purchase. Quantity demanded refers to the amount consumers will buy at one particular price.
4. What are the main factors affecting demand?
The main factors include price, consumer income, preferences, population, prices of related products, expectations, availability of credit, and seasonal conditions. The relative importance of each factor depends on the product and the market.
5. Why is demand important for a business?
Demand helps a business estimate sales, set prices, plan inventory, schedule production, understand customers, and evaluate opportunities. Reliable demand analysis can reduce waste and improve decisions, although it cannot guarantee business success.